K Means Clustering - Exercise
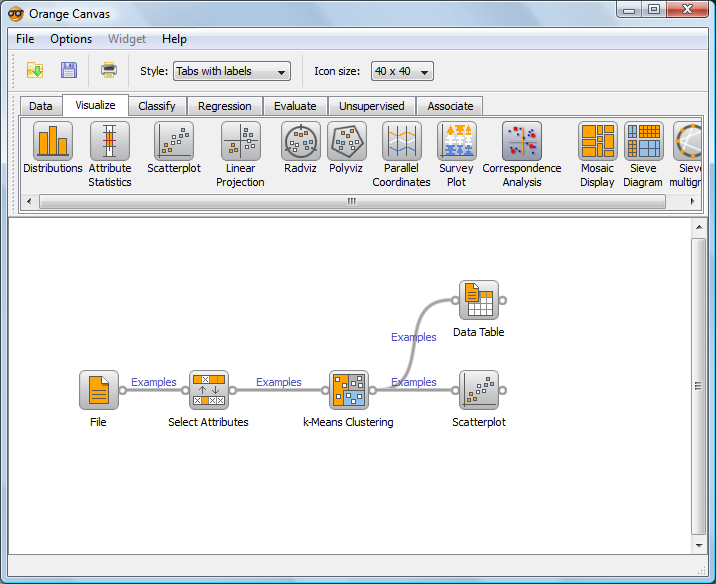
- Open "Orange".
- Drag and drop "File" widget and double click to load a dataset (credit_scoring.txt).
- Drag and drop "Select Attributes" widget and connect it to the "File" widget.
- Open "Select Attributes" and set the class (target) and attributes (predictors).
- Drag and drop "k-Means Clustering" widget and connect it to the "Select Attributes" widget.
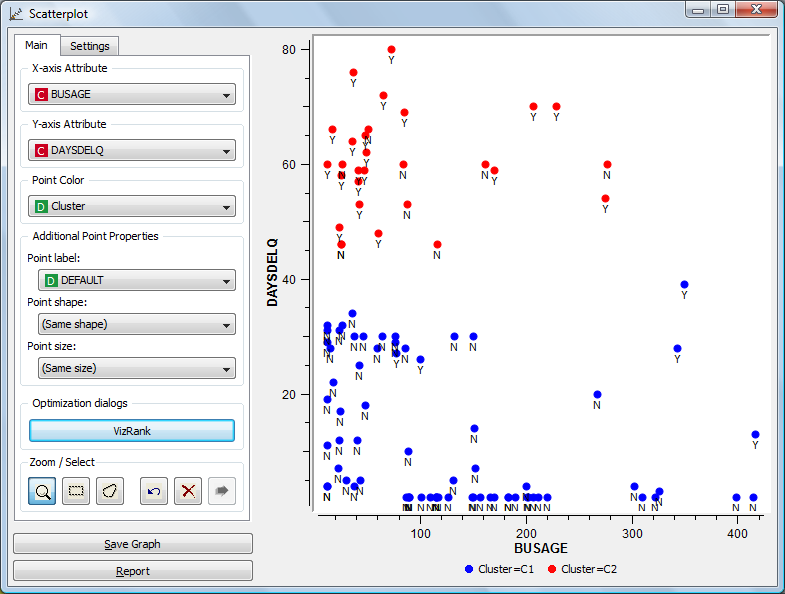
- Drag and drop "Scatterplot" widget and connect it to the "k-Means Clustering" widget to view the plot with the class label.
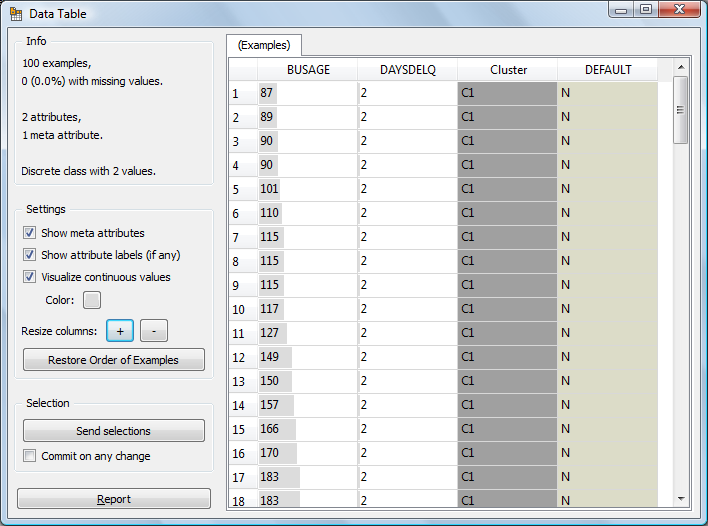
- Drag and drop "Data Tables" widget and connect it to the "k-Means Clustering" widget to view the dataset with a new cluster column.
Scatter Plot
Dataset with Clusters