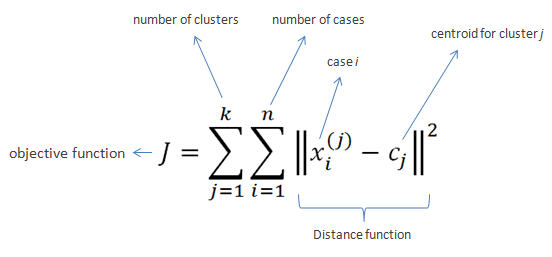
K-Means Clustering
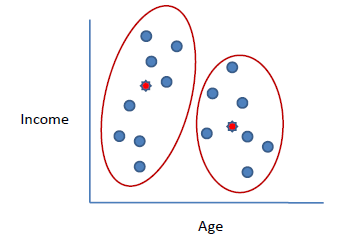
- Clusters the data into k groups where k is predefined.
- Select k points at random as cluster centers.
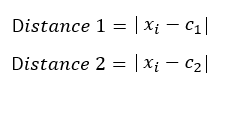
- Assign objects to their closest cluster center according to the Euclidean distance function.
- Calculate the centroid or mean of all objects in each cluster.
- Repeat steps 2, 3 and 4 until the same points are assigned to each cluster in consecutive rounds.
n = 19
15,15,16,19,19,20,20,21,22,28,35,40,41,42,43,44,60,61,65
k = 2
c1 = 16
c2 = 22
c2 = 36.25
| xi | c1 | c2 | Distance 1 | Distance 2 | Nearest Cluster | New Centroid |
| 15 | 16 | 22 | 1 | 7 | 1 | 15.33 |
| 15 | 16 | 22 | 1 | 7 | 1 | |
| 16 | 16 | 22 | 0 | 6 | 1 | |
| 19 | 16 | 22 | 3 | 3 | 2 | 36.25 |
| 19 | 16 | 22 | 3 | 3 | 2 | |
| 20 | 16 | 22 | 4 | 2 | 2 | |
| 20 | 16 | 22 | 4 | 2 | 2 | |
| 21 | 16 | 22 | 5 | 1 | 2 | |
| 22 | 16 | 22 | 6 | 0 | 2 | |
| 28 | 16 | 22 | 12 | 6 | 2 | |
| 35 | 16 | 22 | 19 | 13 | 2 | |
| 40 | 16 | 22 | 24 | 18 | 2 | |
| 41 | 16 | 22 | 25 | 19 | 2 | |
| 42 | 16 | 22 | 26 | 20 | 2 | |
| 43 | 16 | 22 | 27 | 21 | 2 | |
| 44 | 16 | 22 | 28 | 22 | 2 | |
| 60 | 16 | 22 | 44 | 38 | 2 | |
| 61 | 16 | 22 | 45 | 39 | 2 | |
| 65 | 16 | 22 | 49 | 43 | 2 |
c2 = 45.90
| xi | c1 | c2 | Distance 1 | Distance 2 |
Nearest Cluster |
New Centroid |
| 15 | 15.33 | 36.25 | 0.33 | 21.25 | 1 | 18.56 |
| 15 | 15.33 | 36.25 | 0.33 | 21.25 | 1 | |
| 16 | 15.33 | 36.25 | 0.67 | 20.25 | 1 | |
| 19 | 15.33 | 36.25 | 3.67 | 17.25 | 1 | |
| 19 | 15.33 | 36.25 | 3.67 | 17.25 | 1 | |
| 20 | 15.33 | 36.25 | 4.67 | 16.25 | 1 | |
| 20 | 15.33 | 36.25 | 4.67 | 16.25 | 1 | |
| 21 | 15.33 | 36.25 | 5.67 | 15.25 | 1 | |
| 22 | 15.33 | 36.25 | 6.67 | 14.25 | 1 | |
| 28 | 15.33 | 36.25 | 12.67 | 8.25 | 2 | 45.9 |
| 35 | 15.33 | 36.25 | 19.67 | 1.25 | 2 | |
| 40 | 15.33 | 36.25 | 24.67 | 3.75 | 2 | |
| 41 | 15.33 | 36.25 | 25.67 | 4.75 | 2 | |
| 42 | 15.33 | 36.25 | 26.67 | 5.75 | 2 | |
| 43 | 15.33 | 36.25 | 27.67 | 6.75 | 2 | |
| 44 | 15.33 | 36.25 | 28.67 | 7.75 | 2 | |
| 60 | 15.33 | 36.25 | 44.67 | 23.75 | 2 | |
| 61 | 15.33 | 36.25 | 45.67 | 24.75 | 2 | |
| 65 | 15.33 | 36.25 | 49.67 | 28.75 | 2 |
c2 = 47.89
| xi | c1 | c2 | Distance 1 | Distance 2 | Nearest Cluster | New Centroid |
| 15 | 18.56 | 45.9 | 3.56 | 30.9 | 1 | 19.50 |
| 15 | 18.56 | 45.9 | 3.56 | 30.9 | 1 | |
| 16 | 18.56 | 45.9 | 2.56 | 29.9 | 1 | |
| 19 | 18.56 | 45.9 | 0.44 | 26.9 | 1 | |
| 19 | 18.56 | 45.9 | 0.44 | 26.9 | 1 | |
| 20 | 18.56 | 45.9 | 1.44 | 25.9 | 1 | |
| 20 | 18.56 | 45.9 | 1.44 | 25.9 | 1 | |
| 21 | 18.56 | 45.9 | 2.44 | 24.9 | 1 | |
| 22 | 18.56 | 45.9 | 3.44 | 23.9 | 1 | |
| 28 | 18.56 | 45.9 | 9.44 | 17.9 | 1 | |
| 35 | 18.56 | 45.9 | 16.44 | 10.9 | 2 | 47.89 |
| 40 | 18.56 | 45.9 | 21.44 | 5.9 | 2 | |
| 41 | 18.56 | 45.9 | 22.44 | 4.9 | 2 | |
| 42 | 18.56 | 45.9 | 23.44 | 3.9 | 2 | |
| 43 | 18.56 | 45.9 | 24.44 | 2.9 | 2 | |
| 44 | 18.56 | 45.9 | 25.44 | 1.9 | 2 | |
| 60 | 18.56 | 45.9 | 41.44 | 14.1 | 2 | |
| 61 | 18.56 | 45.9 | 42.44 | 15.1 | 2 | |
| 65 | 18.56 | 45.9 | 46.44 | 19.1 | 2 |
c2 = 47.89
| xi | c1 | c2 | Distance 1 | Distance 2 | Nearest Cluster | New Centroid |
| 15 | 19.5 | 47.89 | 4.50 | 32.89 | 1 | 19.50 |
| 15 | 19.5 | 47.89 | 4.50 | 32.89 | 1 | |
| 16 | 19.5 | 47.89 | 3.50 | 31.89 | 1 | |
| 19 | 19.5 | 47.89 | 0.50 | 28.89 | 1 | |
| 19 | 19.5 | 47.89 | 0.50 | 28.89 | 1 | |
| 20 | 19.5 | 47.89 | 0.50 | 27.89 | 1 | |
| 20 | 19.5 | 47.89 | 0.50 | 27.89 | 1 | |
| 21 | 19.5 | 47.89 | 1.50 | 26.89 | 1 | |
| 22 | 19.5 | 47.89 | 2.50 | 25.89 | 1 | |
| 28 | 19.5 | 47.89 | 8.50 | 19.89 | 1 | |
| 35 | 19.5 | 47.89 | 15.50 | 12.89 | 2 | 47.89 |
| 40 | 19.5 | 47.89 | 20.50 | 7.89 | 2 | |
| 41 | 19.5 | 47.89 | 21.50 | 6.89 | 2 | |
| 42 | 19.5 | 47.89 | 22.50 | 5.89 | 2 | |
| 43 | 19.5 | 47.89 | 23.50 | 4.89 | 2 | |
| 44 | 19.5 | 47.89 | 24.50 | 3.89 | 2 | |
| 60 | 19.5 | 47.89 | 40.50 | 12.11 | 2 | |
| 61 | 19.5 | 47.89 | 41.50 | 13.11 | 2 | |
| 65 | 19.5 | 47.89 | 45.50 | 17.11 | 2 |
| Exercise |  |