Numerical & Numerical - Exercise
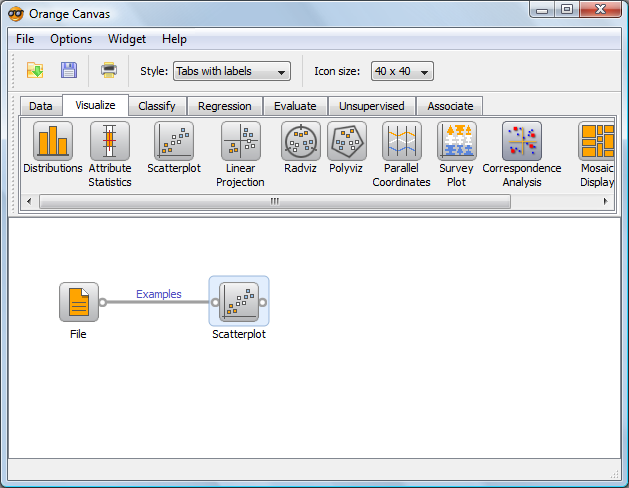
- Open "Orange".
- Drag and drop "File" widget and double click to load a dataset (iris.txt).
- Drag and drop "Scatterplot" widget and connect it to the "File" widget.
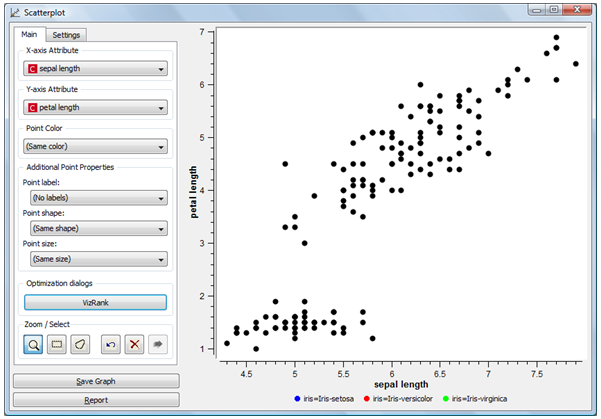
- Double-click on the "Scatterplot" to see the plot.
| Map > Data Science > Explaining the Past > Data Exploration > Bivariate Analysis > Numerical & Numerical > Exercise | ||
Numerical & Numerical - Exercise |
||
|
||
|
|
||
|
|
||