| Map
> Data Science > Predicting the Future >
Modeling > Clustering
> Self Organizing Map |
|
|
|
|
|
|
Self Organizing
Map
|
|
|
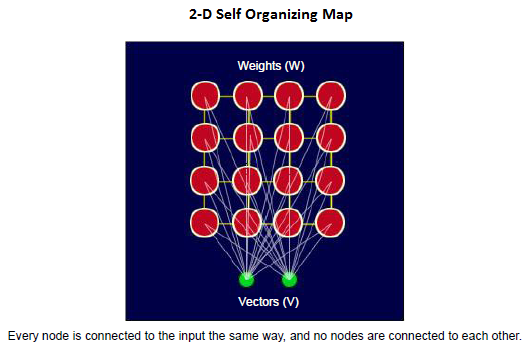
| Self organizing Map (SOM) is used for visualization and analysis of high-dimensional datasets. SOM facilitate presentation of high dimensional datasets into lower dimensional ones, usually 1-D, 2-D and 3-D. It is an unsupervised learning algorithm, and does not require a target vector since it learns to classify data without supervision.
A SOM is formed from a grid of nodes or units to which the input data are presented.
Every node is connected to the input, and there is no connection between the nodes.
SOM is a topology preserving technique and keeps the neighborhood relations in its mapping presentation. |
|
|
|
|
|
|
| |
|
|
| Algorithm |
|
|
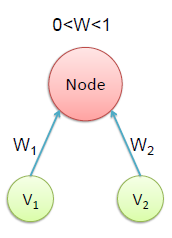
| 1- Initialization of each node’s weights
with a random number between 0 and 1 |
|
|
|
|
|
|
| 2- Choosing a random input vector from training dataset |
|
|
| |
|
|
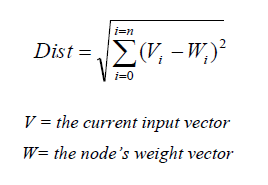
| 3- Calculating the Best Matching Unit (BMU).
Each node is examined to find the one which its weights are most similar to the input vector. This unit is known as the Best Matching Unit (BMU) since its vector is most similar to the input vector. This selection is done by Euclidean distance formula, which is a measure of similarity between two datasets. The distance between the input vector and the weights of node is calculated in order to find the BMU. |
|
|
|
|
|
|
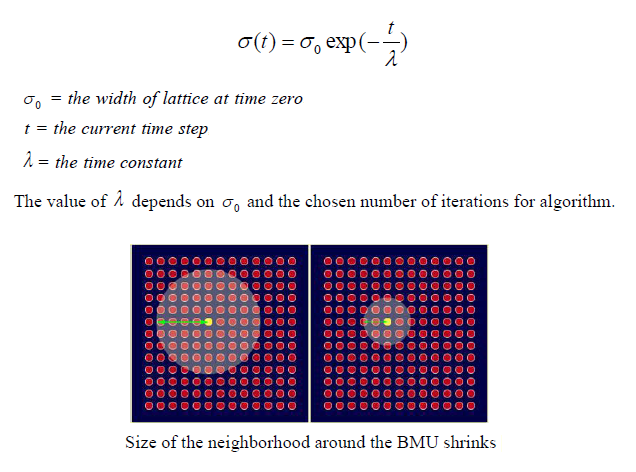
| 4- Calculating the size of the neighborhood around the BMU.The size of the neighborhood around the BMU is decreasing with an exponential decay function. It shrinks on each iteration until reaching just the BMU. |
|
|
|
|
|
|
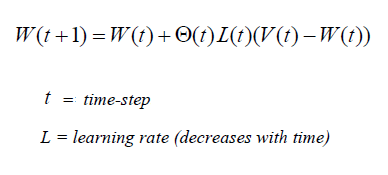
| 5- Modification of nodes’ weights of the BMU and neighboring nodes, so that their weight gets more similar to the weight of input vector.
The weight of every node within the neighborhood is adjusted, having greater change for neighbors closer to the BMU. |
|
|
|
|
|
|
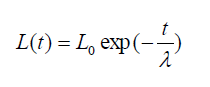
| The decay of learning rate is calculated for each iteration. |
|
|
|
|
|
|
| As training goes on, the neighborhood gradually shrinks. At the end of training, the
neighborhoods have shrunk to zero size. |
|
|
|
|
|
|
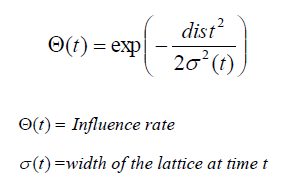
| The influence rate shows amount of influence a
node's distance from the BMU has on its learning. In the simplest form influence rate is equal to 1 for all the nodes close to the BMU and zero for others, but a
Gaussian function is common too. Finally, from a random distribution of weights and through much iteration, SOM is able to arrive at a map of stable zones. At the end, interpretation of data is to be done by human but SOM is a great technique to present the invisible patterns in the data. |
|
|
| |
|
|
|
|
|
|
| |
|
|
|
|
|
|
|
|
