Numerical Variables
| Univariate Analysis - Numerical | |||
| Statistics | Visualization | Equation | Description |
| Count | Histogram | N |
The number of values (observations) of the variable. |
| Minimum | Box Plot | Min |
The smallest value of the variable. |
| Maximum | Box Plot | Max |
The largest value of the variable. |
| Mean | Box Plot |
|
The sum of the values divided by the count. |
| Median | Box Plot |
|
The middle value. Below and above median lies an equal number of values. |
| Mode | Histogram |
The most frequent value. There can be more than one mode. |
|
| Quantile | Box Plot |
|
A set of 'cut points' that divide a set of data into groups containing equal numbers of values (Quartile, Quintile, Percentile, ...). |
| Range | Box Plot |
Max-Min |
The difference between maximum and minimum. |
| Variance | Histogram |
|
A measure of data dispersion. |
| Standard Deviation | Histogram |
|
The square root of variance. |
| Coefficient of Variation | Histogram |
|
A measure of data dispersion divided by mean. |
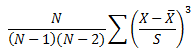
| Skewness | Histogram |
|
A measure of symmetry or asymmetry in the distribution of data. |
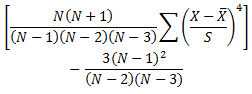
| Kurtosis | Histogram |
|
A measure of whether the data are peaked or flat relative to a normal distribution. |
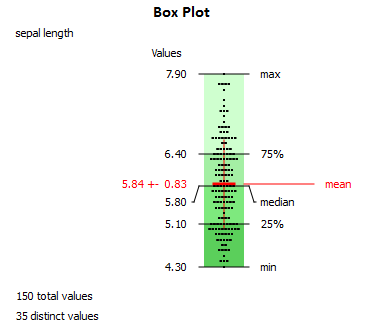
Example:
Statistical analysis using Microsoft Excel (Iris.xls)
|
sepal length |
|
| Count | 150 |
| Minimum | 4.3 |
| Maximum | 7.9 |
| Mean | 5.84 |
| Median | 5.8 |
| Mode | 5 |
| Quartile 1 | 5.1 |
| Range | 3.6 |
| Variance | 0.69 |
| Standard Deviation | 0.83 |
| Coefficient of Variation | 14.2% |
| Skewness | 0.31 |
| Kurtosis | -0.55 |
| Exercise |  |