Bivariate Analysis - Categorical & Categorical
Stacked Column Chart
Combination Chart
Chi-square Test
| Exercise |  |
| Map > Data Science > Explaining the Past > Data Exploration > Bivariate Analysis > Categorical & Categorical | |||||
Bivariate Analysis - Categorical & Categorical |
|||||
Stacked Column Chart |
|||||
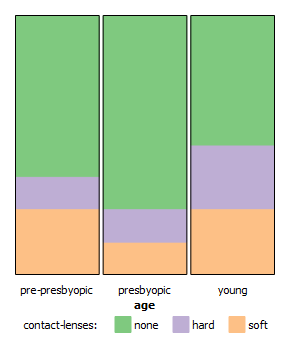
| Stacked Column chart is a useful graph to visualize the relationship between two categorical variables. It compares the percentage that each category from one variable contributes to a total across categories of the second variable. | |||||
|
|
|||||
Combination Chart |
|||||
| A combination chart uses two or more chart types to emphasize that the chart contains different kinds of information. Here, we use a bar chart to show the distribution of one categorical variable and a line chart to show the percentage of the selected category from the second categorical variable. The combination chart is the best visualization method to demonstrate the predictability power of a predictor (X-axis) against a target (Y-axis). | |||||
|
|
|||||
Chi-square Test |
|||||
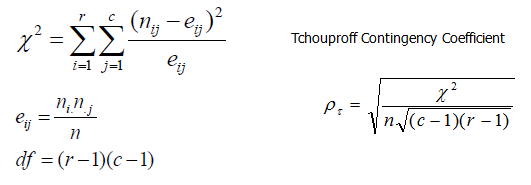
| The chi-square test can be used to determine the association between categorical variables. It is based on the difference between the expected frequencies (e) and the observed frequencies (n) in one or more categories in the frequency table. The chi-square distribution returns a probability for the computed chi-square and the degree of freedom. A probability of zero shows a complete dependency between two categorical variables and a probability of one means that two categorical variables are completely independent. Tchouproff Contingency Coefficient measures the amount of dependency between two categorical variables. | |||||
|
|
|||||
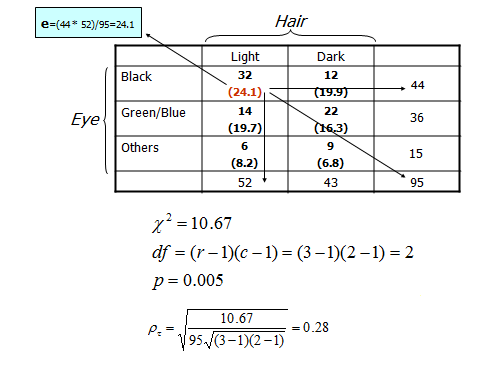
| Example: | |||||
| The following frequency table (contingency table) with a chi-square of 10.67, degree of freedom (df) of 2 and probability of 0.005 shows a significant dependency between two categorical variables (hair and eye colors). | |||||
|
|
|||||
|
|||||