| Map > Problem Definition > Data Preparation > Data Exploration > Modeling > Evaluation > Classification |
Evaluation - Classification |
| I. Data Preparation |
|
1- Load libraries |
|
library(data.table) library(formattable) library(plotrix) library(dplyr) library(Rtsne) library(MASS) library(xgboost) library(factoextra) library(caTools) library(pROC) library(caret) library(gains) library(lift) |
|
2- Read Expressions file |
|
df <- read.csv("GSE74763_rawlog_expr.csv") df2 <- df[,-1] rownames(df2) <- df[,1] expr <- transpose(df2) rownames(expr) <- colnames(df2) colnames(expr) <- rownames(df2) dim(expr) |
|
3- Read Samples file |
|
targets <- read.csv("GSE74763_rawlog_targets.csv") colnames(targets) dim(targets) |
|
4- Merge Expressions with Samples |
|
data <- cbind(expr, targets) colnames(data) dim(data) |
| II. Splitting Data into Training and Test Sets |
|
set.seed(101) d1 <- data groups <- as.fumeric(data$target) sample = sample.split(d1$target, SplitRatio = .8) train = subset(d1, sample == TRUE) test = subset(d1, sample == FALSE) dim(train) dim(test) |
|
|
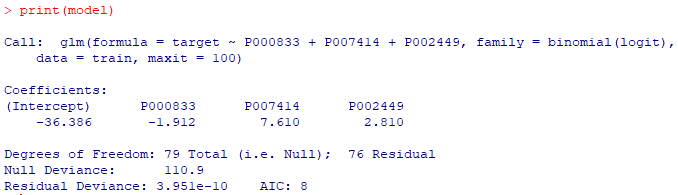
| III. Logistic Regression |
|
#train model <- glm(target ~ P000833+P007414+P002449, data = train, family=binomial(logit), maxit = 100) print(model) #test pb <- predict(model, test, type="response") pb <- as.data.frame(pb) |
|
|
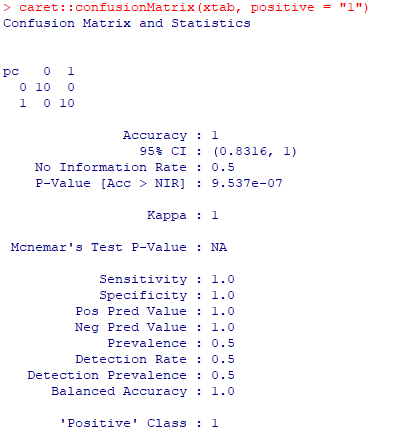
| IV. Confusion Matrix |
|
pc <- NULL pc <- ifelse(pb$pb > 0.5,"1","0") summary(pc) xtab <- table(pc, test$target) caret::confusionMatrix(xtab, positive = "1") |
|
|
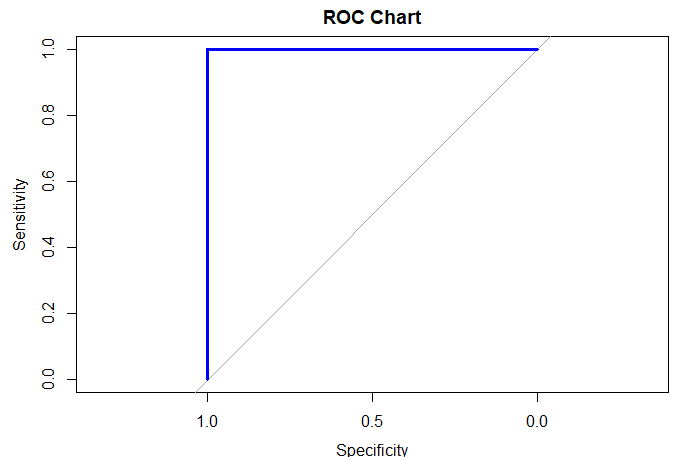
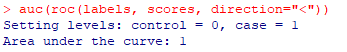
| V. ROC Chart |
| pb <- NULL pb <- predict(model, test, type="response") pb <- as.data.frame(pb) labels <- test$target scores <- pb$pb plot(roc(labels, scores, direction="<"), col="blue", lwd=3, main="ROC Chart") auc(roc(labels, scores, direction="<")) |
|
|
|
|
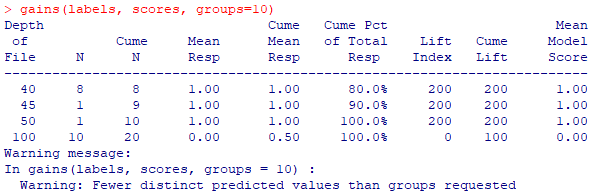
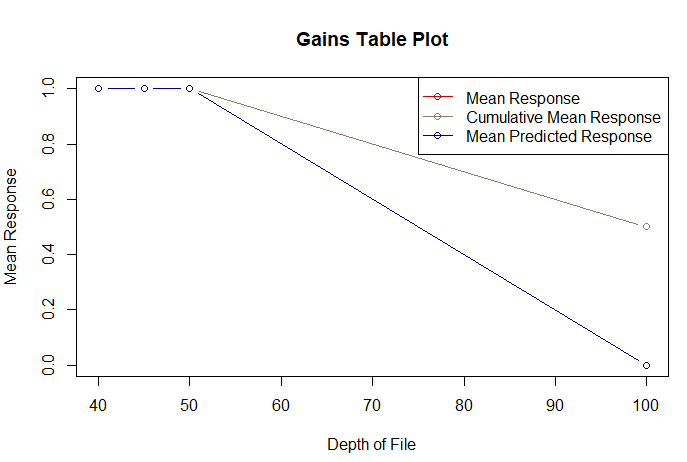
| VI. Gain and Lift Charts |
| pb <- NULL pb <- predict(model, test, type="response") pb <- as.data.frame(pb) labels <- test$target scores <- pb$pb gains(labels, scores, groups=10) plot(gains(labels, scores, groups=10)) plotLift(scores, labels, cumulative = TRUE, n.buckets = 10) |
|
|
|
|
|
|
| VII. Bioada SmartArray |
| Watch this video to learn how you can perform classification model evaluation using Bioada SmartArray significantly faster and easier. |